01 · ANALYZE
Methodology and diagnostic logic
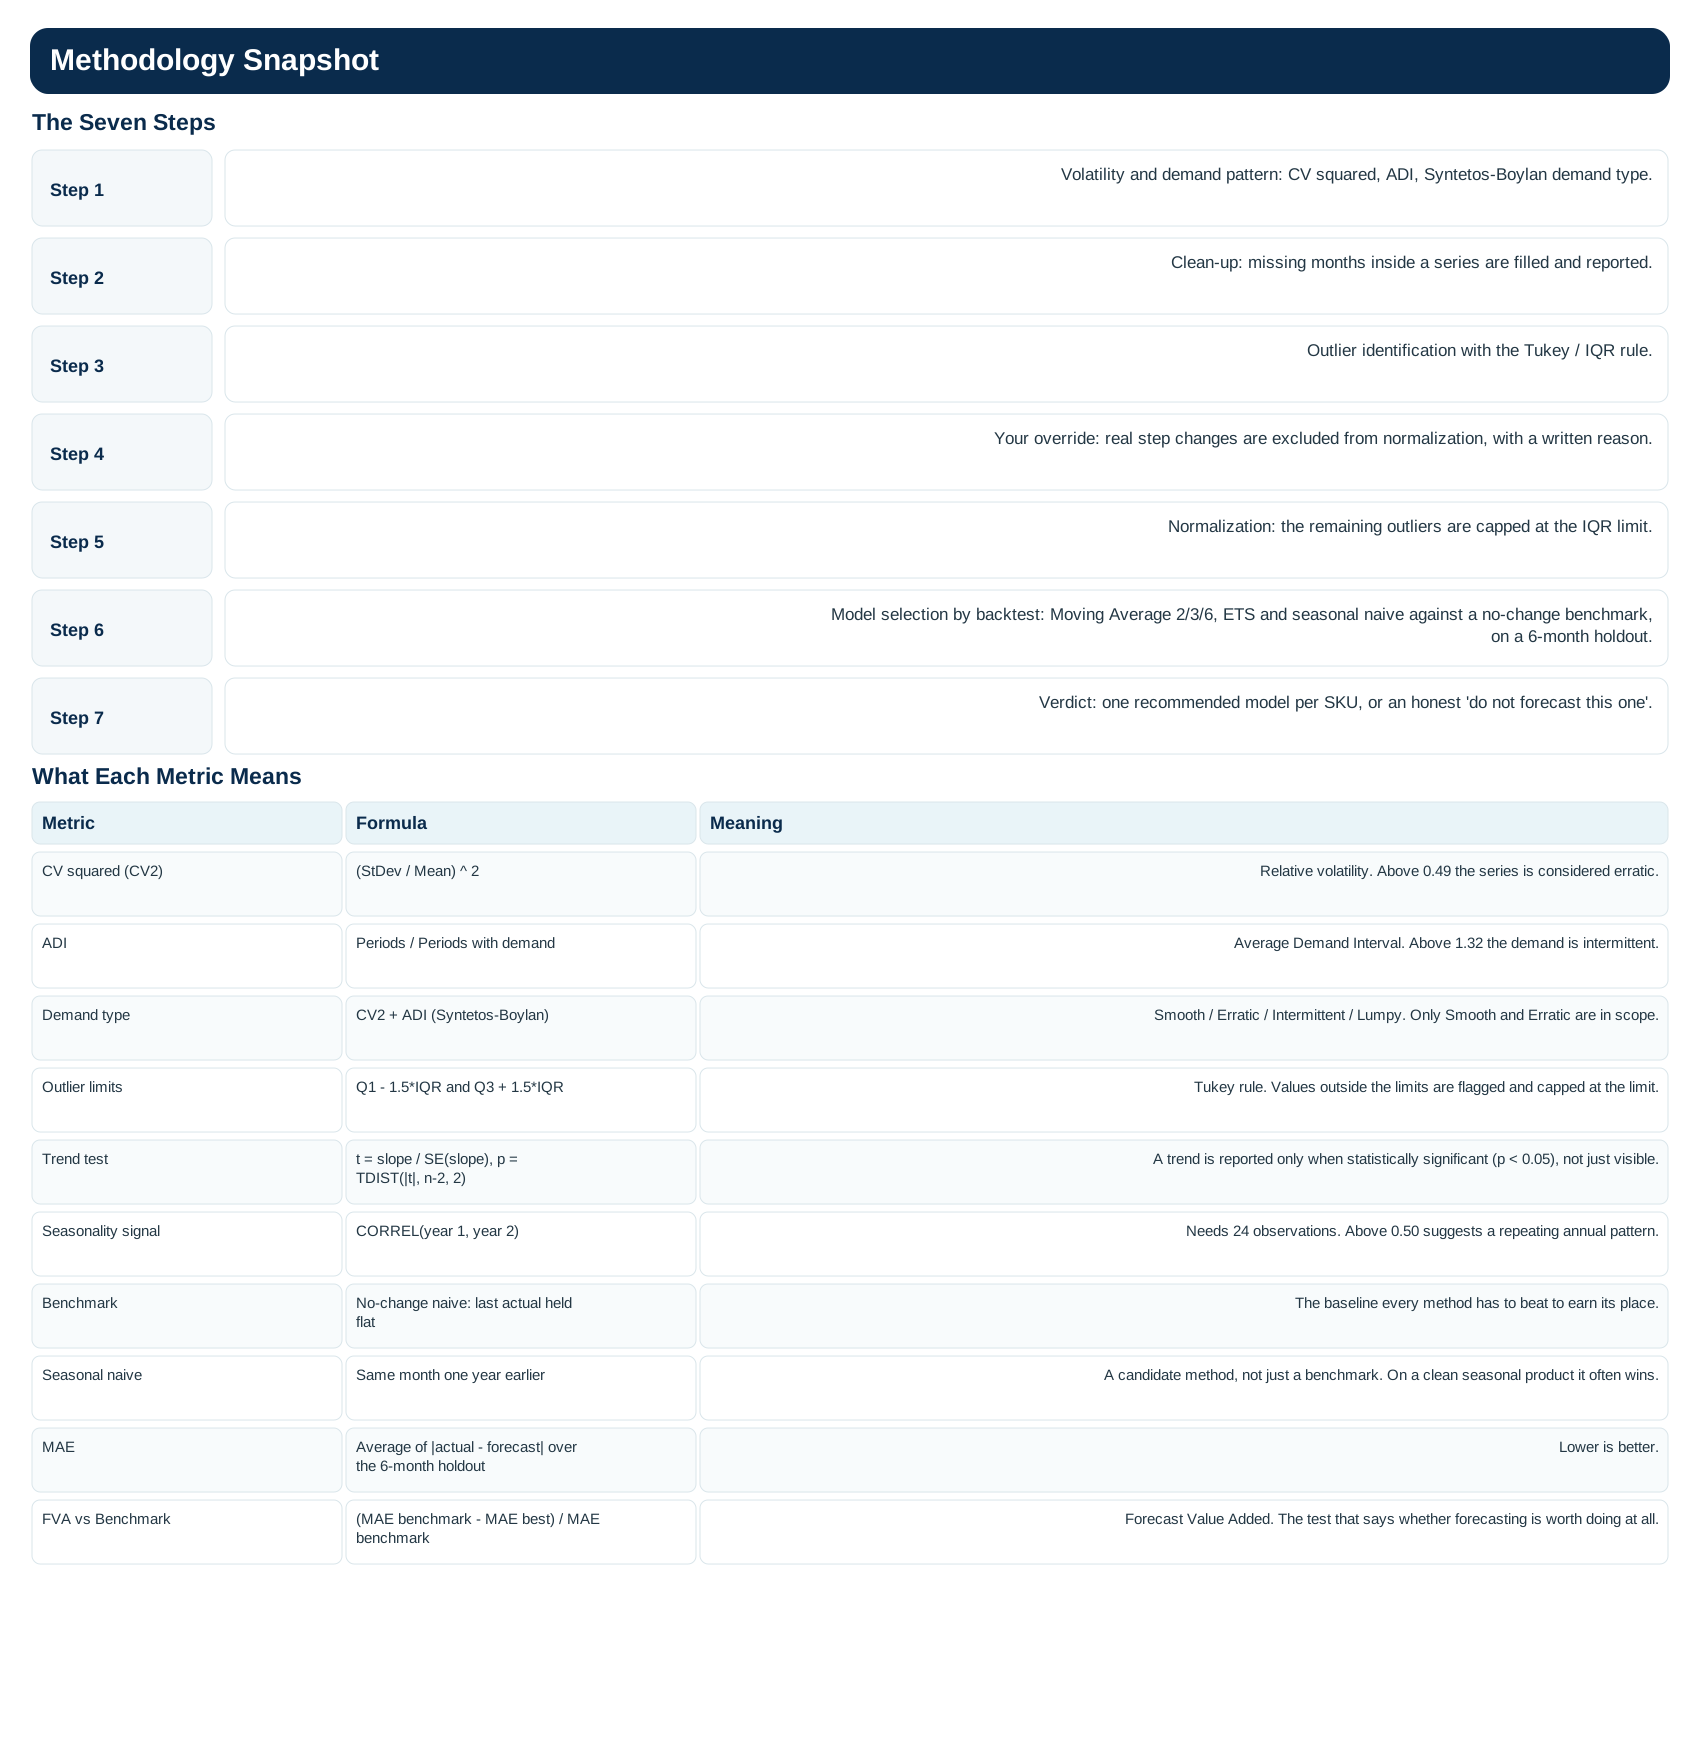
The kit begins with a transparent seven-step process and clearly defined metrics. The planner can see what is being tested and why.
Turn historical demand into a structured, explainable forecast—and make performance, assumptions and business adjustments visible in one practical planning workflow.
Demand Planning is designed for organizations that need more structure than a basic spreadsheet forecast, without the complexity or cost of a large enterprise planning platform.
It combines statistical forecasting, historical analysis and business judgment so the forecast is not treated as a black box. The objective is simple: create a plan that can be understood, challenged, measured and improved over time.
The value of Demand Planning is not the forecast file itself. It is the ability to understand the demand signal, challenge assumptions and improve the decisions that follow.
Separate recurring demand patterns from unusual events, data issues and one-time activity.
See performance at the level where decisions are made—from overall plan to family and SKU.
Keep commercial knowledge visible instead of silently overwriting the statistical baseline.
Use Forecast Accuracy, Bias and MAPE to understand both magnitude and direction of forecast error.
Spend planning time on exceptions and meaningful gaps instead of reviewing every item the same way.
Create a common baseline for Sales, Finance, Supply and other stakeholders to discuss one plan.
Review historical performance, new forecast and key assumptions before the formal demand meeting.
Identify where Accuracy or Bias has deteriorated and focus discussion on root causes.
Find products that require attention instead of spending equal time across the full portfolio.
Document when and why the business view should differ from the statistical baseline.
The toolkit is built as a planning workflow, not just a forecast output. It starts by understanding the data, selects an appropriate forecasting approach, creates a statistical baseline, captures business judgment explicitly and then measures performance against prior forecast runs.
Review demand history, data quality, outliers and recent behavior.
Identify forecastability, demand type and areas that need intervention.
Use diagnostics and model performance to choose the most appropriate method by SKU.
Create the statistical baseline for the forward planning horizon.
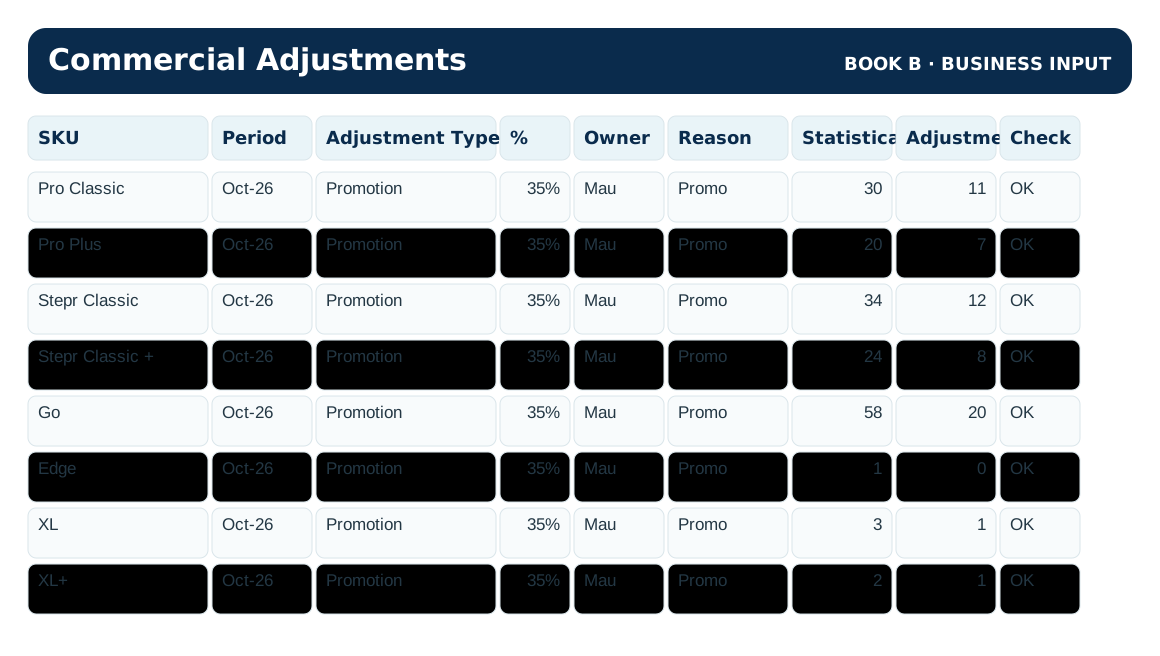
Document commercial adjustments with owner, reason and impact.
Review Forecast Accuracy, Bias, MAPE and changes versus previous runs.
These views come directly from the toolkit workflow. They show how the process diagnoses the portfolio, chooses a method, creates the statistical baseline, captures business input and publishes the final plan.
The kit begins with a transparent seven-step process and clearly defined metrics. The planner can see what is being tested and why.
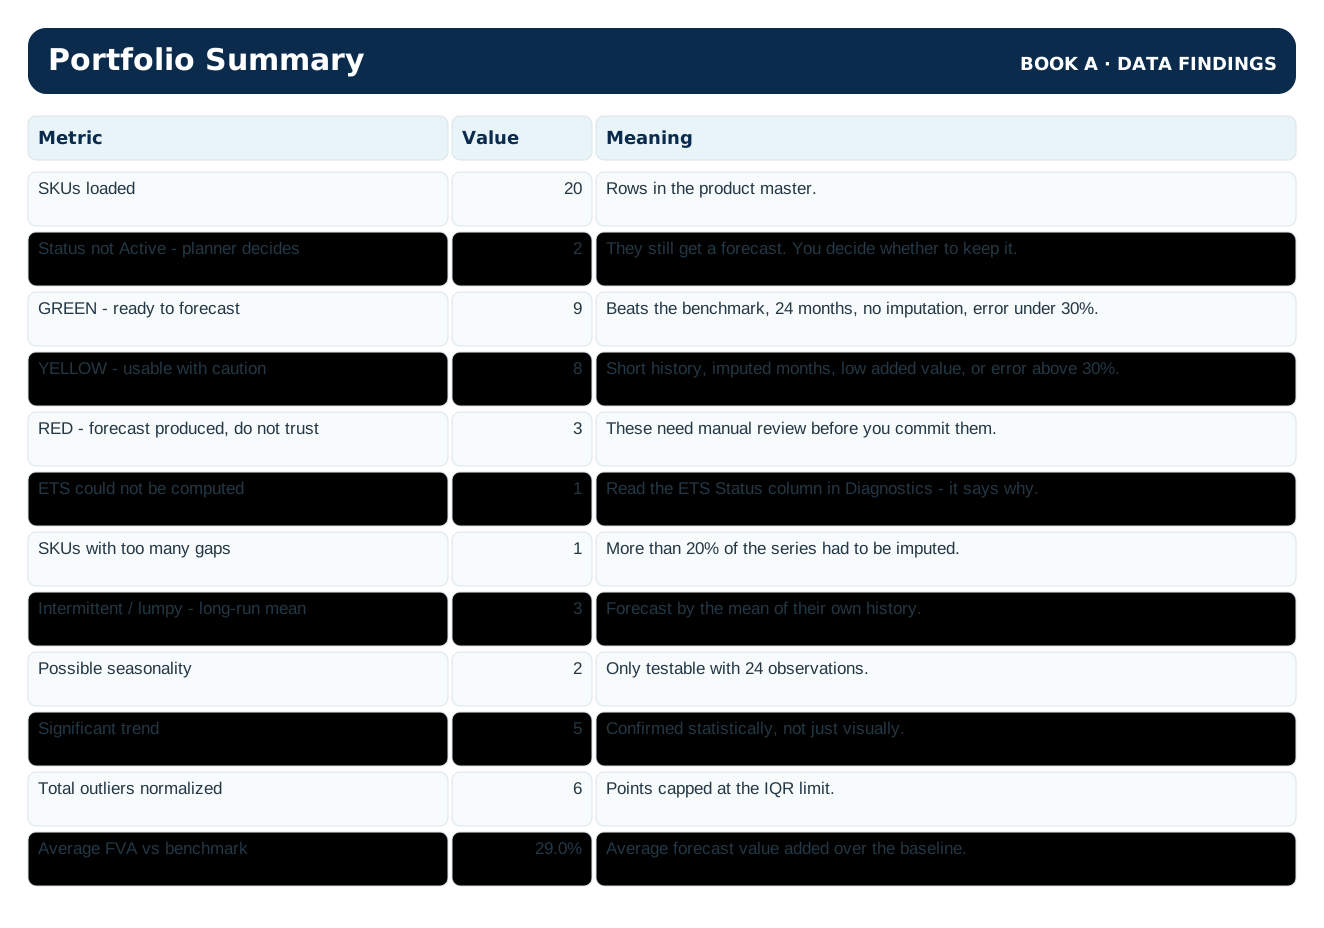
Portfolio diagnostics summarize which SKUs are ready to forecast, which need caution and where the data requires review.
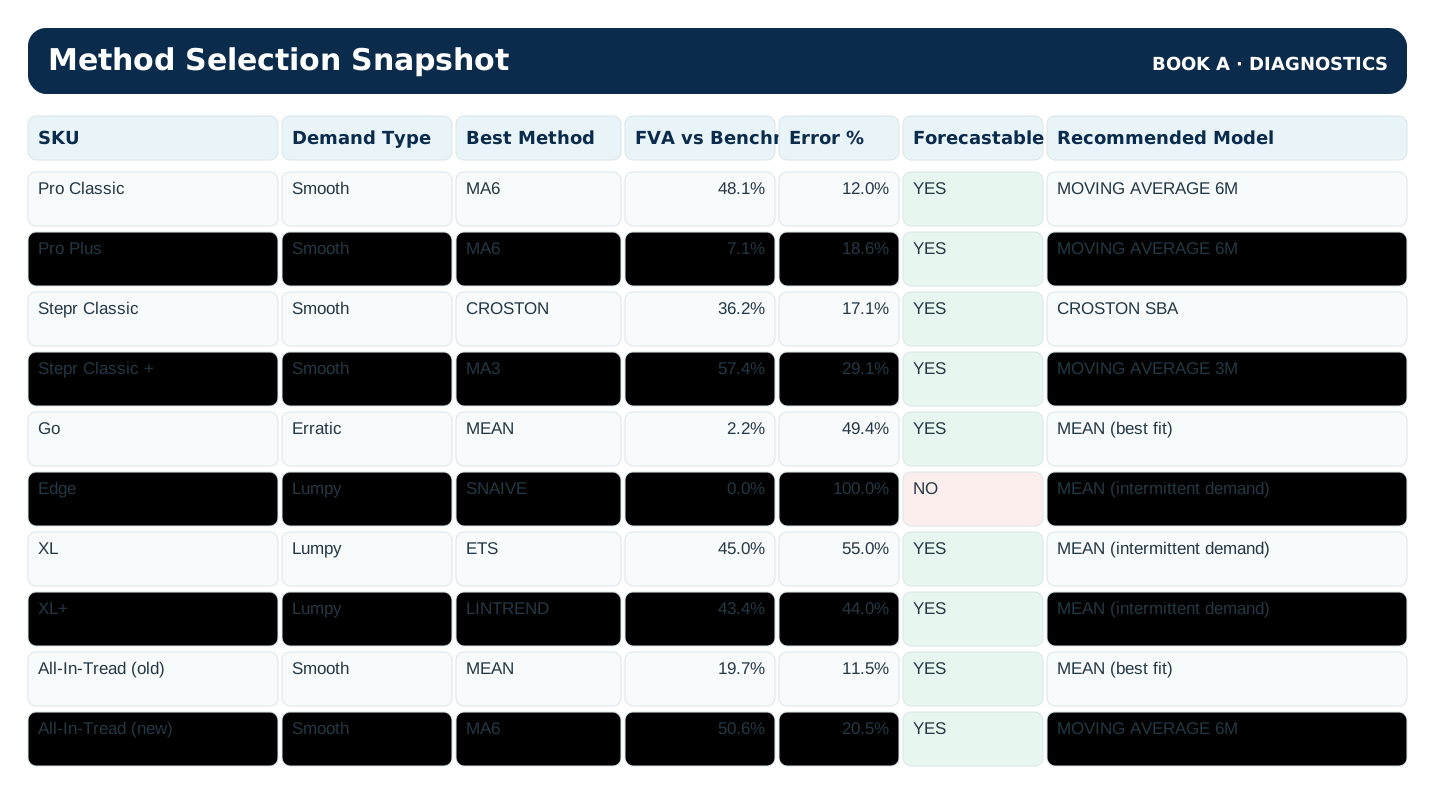
Demand type, backtest performance, FVA and forecastability are evaluated before the recommended model is carried into the forecast engine.
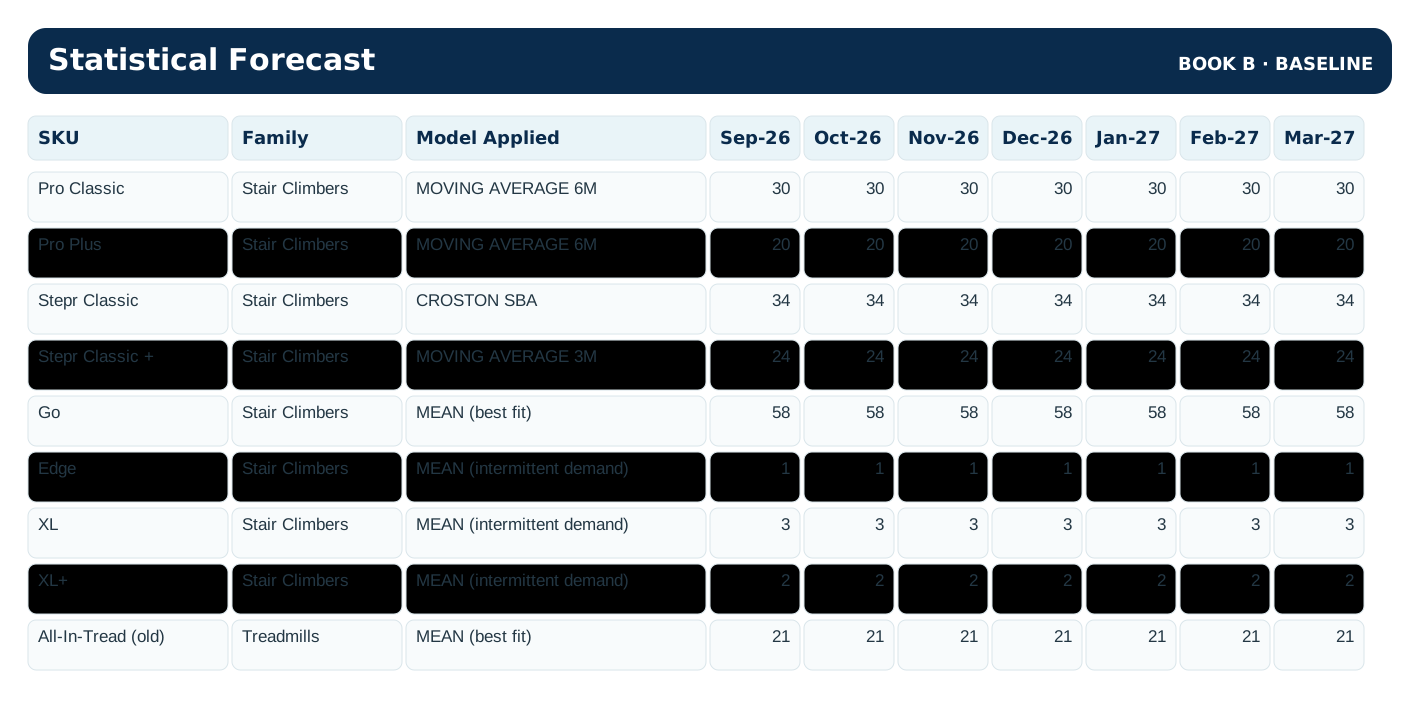
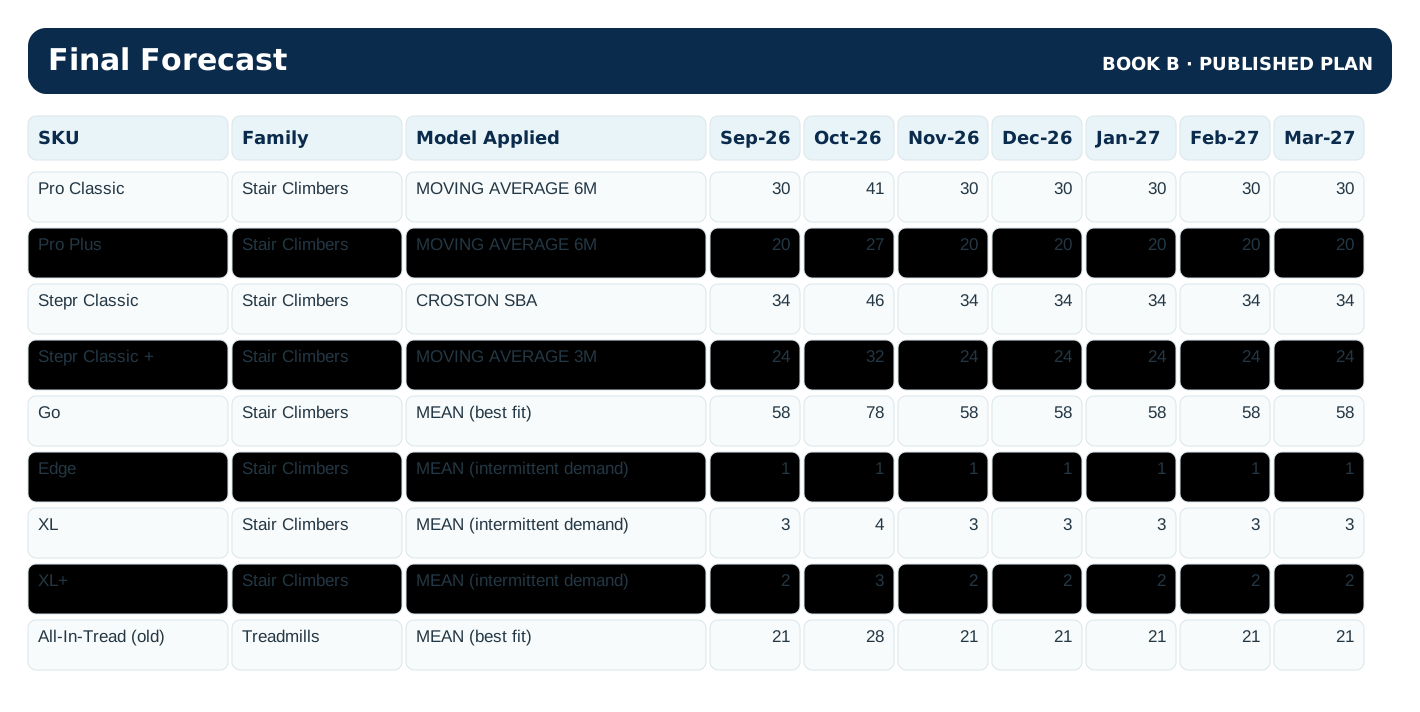
Book B converts the selected model into a forward forecast by SKU and month. This is the objective starting point—not the final answer.
Commercial adjustments are documented with period, adjustment type, owner and reason so the change is explicit and defensible.
The final forecast combines the statistical baseline with approved business input and becomes the plan that can be reviewed in the dashboard.
Explore the planning and performance views using sample data. Change family, SKU, Units/Value and move between Plan and Performance. The public demo is read-only: data upload, import/export, saving versions and printing are disabled.
You can purchase the forecasting engine by itself, the dashboard by itself, or the complete package. The Full version is the most complete planning and review experience.
For teams that want the forecasting methodology, engine and outputs without the dashboard layer.
Standalone HTML dashboard for users who only want the visualization and review layer.
Delivered as-is. No setup, data-loading assistance, customization, integration or technical support is included.
For teams that want the forecasting engine plus the full interactive planning and performance review experience.
Digital product sales are final. Purchases are non-refundable once delivered or downloaded, except where required by applicable law.
Applicable taxes may be added at checkout depending on customer location and local tax requirements. Checkout is securely processed by Paddle. Files are released only after the completed transaction is verified.
You need more structure, governance and visibility than a basic forecast spreadsheet provides, but do not need—or are not ready for—the cost and complexity of a large enterprise planning suite.
Reliable historical demand, disciplined monthly review and business users willing to challenge assumptions rather than treat the forecast as an automatic answer.
Explore the public dashboard demo, then choose Forecast Only, Dashboard Only or the Complete Package when checkout is connected.
Product capabilities and examples shown illustrate the planning workflow. Actual outcomes depend on data quality, process maturity and execution discipline. Advisory services are available separately through Contact.